
This is part 3 of our Building Impact Radius series: Part 1: From Problem to Foundation | Part 2: The Technical Breakthrough | Part 3: Three Essential Workflows
Most data teams jump straight to expensive data comparisons without understanding the scope of changes first. Here's how Impact Radius fits into three daily workflows: root cause discovery, PR review, and downstream validation.
In our first article, we wrote about how built column-level Impact Radius to answer our users' question, "what do I actually need to validate to ensure my data is right?" In the second article, we discussed the actual technical foundation and UX challenges to make Impact Radius easy to use.
We've discussed the why and the how, so in this article we show how Impact Radius fits into data teams' daily workflows.
Metadata first, data second
Data teams often jump straight to expensive data comparisons without understanding the scope of changes.
The Impact Radius Approach:
- View lineage to understand what changed and what's impacted
- Focus data diffing only on actually impacted areas
This brings 10x faster validation, lower compute costs, higher confidence.
Let's see this approach in action through a Jaffle Shop example where stakeholders reported an issue, and how we as the data team found the root cause, made the change and validated before merging.
Phase 1: Root cause discovery
Marketing noticed supposedly high-value customers weren't spending as much as expected. They requested the data team to find the root cause.
Step 1: Start at the problematic dashboard metric
Click on the problematic dashboard metric: customer_segments.value_segment to enter column-level lineage.

- From the code, we can see that only CLV > 4000 is considered high-value
- From the column-level lineage, we can tell that
value_segmentsis derived fromcustomers.customer_lifetime_value. Meaning, the column is created through transformations applied to upstream columns so we need to look upstream.
⚡ Takeaway from metadata: Problem is not in the customers table. We look upstream.
Step 2: Trace upstream to the source
Click on customers.customer_lifetime_value to check the logic.

We can see the customer lifetime value is calculated here in the CTE of customer_payments.
⚡ Takeaway from metadata: The CLV calculation comes from customers, orders and payments models, so we should keep tracing the issue upstream.
Step 3: Investigate what's in the payments data
To explore more in-depth the payment data for CLV calculation, we ran a custom query.

Now we see the issue, we're including returned and pending orders in CLV! We now have something to discuss with the Marketing team. If high-value customers include some value from returned, pending orders, should we consider them "high-value?" In other words, we've found a semantic definition issue vs. an actual data issue.
⚠️ Target data query: The CLV includes returned and pending orders. We should let the Marketing team know.
Phase 2: Solution Planning
After a discussion with the Marketing team, we decided that only “completed” orders should be used to calculate customer lifetime value.
Step 1: Before I make this change, what will be impacted?
Since the problem is in the CTE in the customersmodel, the fix should be easy. I just need to add a orders.status = completed as the filter. But before I make this change, I want to know what else could be impacted.
Click on customers.customer_lifetime_value and this time look downstream.

- From the column-level lineage, we can tell that
value_segmentsis derived fromcustomers.customer_lifetime_value, we need to check the numbers after the change. - We also know that
customer_segments.net_customer_lifetime_valueis a passthrough column. This means that column is directly selected from the upstream table, so we don’t need to validate that one as long as we confirm thecustomers.net_customer_lifetime_valueis correct.
⚡ Takeaway from metadata: We need to make sure we validate customer_segments.value_segment after the change.
Step 2: Fix the problematic column
Now let’s fix the problem and the change diff on Recce.

⚡ Takeaway from metadata: The logic is correct and only impacts customer_segments.value_segments as expected.
Step 3: Since CLV is the main change, let's see how big the impact is.
- Review the code changes by clicking the
customersmodel
- Do a profile diff by clicking the three-dot icon in the column
customer_lifetime_value. We see the distinct count reduced from 1590 to 1494 and the max CLV reduced from 10092 to 6852.

✅ Takeaway: The reduction makes sense since we excluded the incomplete orders like refunds in CLV calculation.
The lineage is easy to navigate and easy to view alongside the code. We can narrow down the scope and then do targeted data diffing when necessary. Now we're confident the change is logically correct, but we know there's a significant numerical impact, so we'd like to validate carefully and notify stakeholders upfront.
Phase 3: Developer Validation
Step 1: What did I actually change?
We continued reviewing these related models by clicking the upstream and downstream, checking the code logic. We found another potential issues that the order amount includes coupons, so we created a net customer lifetime value which excluded coupon, and also created a new model for finance.
Before we created the PR, we wanted to have an overview of my changes.
Launching Recce we saw:

- We modified
stg_payments,customersandcustomer_segments - We created a new model
finance_revenue
⚡ Takeaway from metadata: We modified three models and created one as intended
Step 2: Did I break anything unexpected?
Click Impact Radius to scan this change and its impact at the column level.

- Added a new column
stg_payments.coupon_amountwhich is used byfinance_revenue.net_revenueandcustomers.net_customer_lifetime_value - Changed the logic of
customers.customer_lifetime_valuethat fully impactscustomer_segmentsandcustomer_order_pattern
⚡ Takeaway from metadata: Changes create two impact paths we need to validate
Step 3: Since we identified the two impact paths, let’s trace the new dependency first.
Click on stg_payments.coupon_amount to view its column-level lineage.
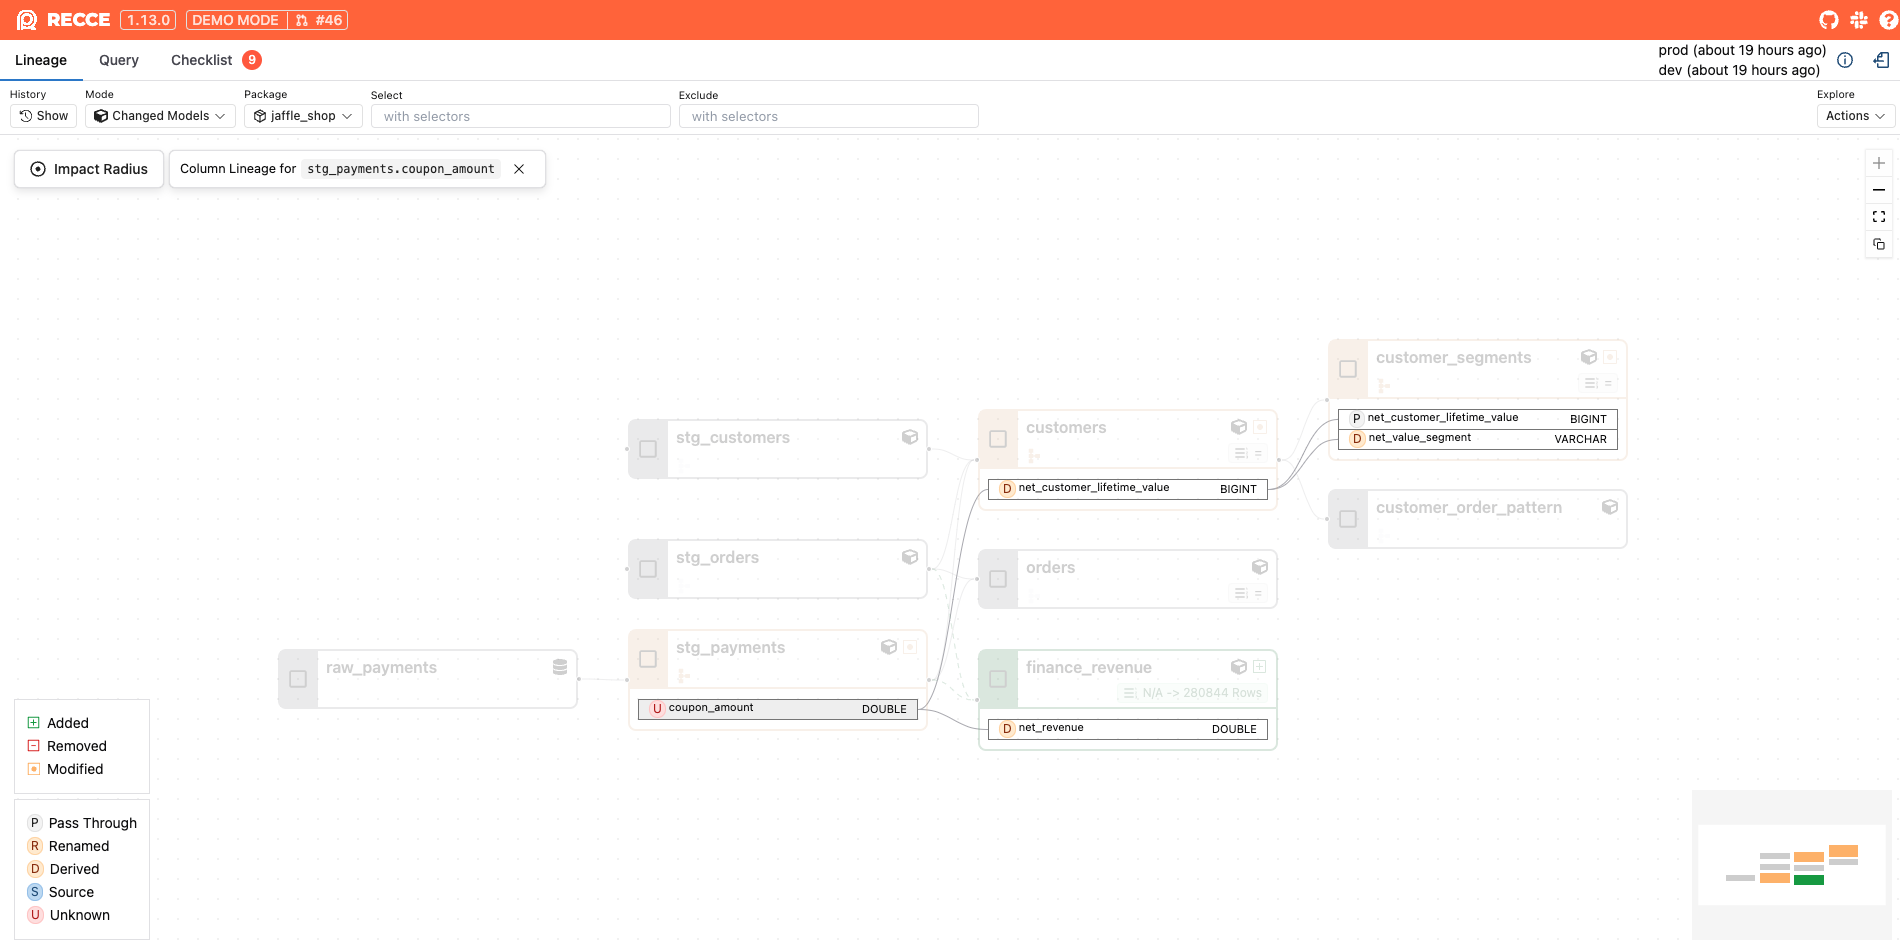
- From here, we can tell that
customers.net_customer_lifetime_value,finance_revenue.net_revenueandcustomer_segments.net_value_segmentsare derived columns.- We can use a custom query to compare only this column before and after.

- Logically, the
net_customer_lifetime_valueshould be less thancustomer_lifetime_value. We can update the custom query to verify this, and it confirms our logic is correct. ✅

- We can use a custom query to compare only this column before and after.
- We also know that
customer_segments.net_customer_lifetime_valueis a passthrough column. This means that column is directly selected from the upstream table, so we don’t need to validate that one as long as we confirm thatcustomers.net_customer_lifetime_valueis correct.
🔍 Targeted data diffing: We’re only need to check these specific columns vs. entire models. Doing this we see the new net CLV calculations are correct.
Step 4: check another impact path, the impact of customer_lifetime_value
Since the customer_order_pattern is fully impacted, we’d like to know what changed. We can click the model and run a profile diff to find out.

Only avg_days_between_orders shows a minor difference, but when viewed with only 2 decimal points, it's the same, so no concern here.

✅ Ship with Confidence: Only intended changes occurred.
Step 5: Notify stakeholders about business metrics changes
We need to show the stakeholders to see the data changes upfront. This allows them to provide feedback about the changes and to adjust their work, e.g., reduce the marketing budget for high-value customers to align with the new CLV.
Do a top-k diff by right-clicking customer_segments.value_segments on the lineage, and we get a clear line chart for stakeholders to spot the impact.

📊 One-click takeaway: Clear charts showing the change impact make it easy for stakeholders to understand the changes.
Step 6: Quantify the excluded orders impact
Besides the chart, we also want to give stakeholders the specific numerical changes and reasons why the high-value customers dropped significantly. We can use data diffing to check exactly how many orders are excluded by running the same query to compare production and development data. This allows us to pinpoint the data differences.

🔢 Change quantified: We excluded 106,650 orders worth $1.66M (32% of total order value), which explains the high-value customer segment decreased significantly.
In these 6 steps, we went through the entire workflow that covers all impacted models and columns and how to communicate the impact and fixes to stakeholders. This gives us confidence that we only changed what we intended.
Phase 4: Data PR Review
Now the PR is created. Let's switch roles to become a teammate reviewing our work with no prior knowledge of the code changes.
As a reviewer, we need to validate that the CLV changes won't affect anything unexpected. Let’s see how Recce can help us validate the PR sooner than before.
Step 1: Map code change to modified models
We already checked the changed files in PR. Now clicking through the Recce link in the PR, we can map the files to modified models.
⚡ A glance at the lineage: The modified models are as expected.
Step 2: Review the proof provided with this PR
We expected customer lifetime value would decrease and so would the high-value customers.
These two checks tell the story.


✅ We ran and saved the results, so reviewers can view them instantly and rerun if they want to make sure.
Step 3: Validate the filtering logic
We want to be thorough, so let’s do a check on new data to verify that all incompleted orders are excluded.

✅ This validation confirms that incomplete orders were previously included and are now properly excluded
Step 4: Provide data-driven stakeholder recommendations
Since we confirmed the code change is correct and excluded 32% of total order value, we can suggest to the stakeholders whether they want to adjust the segmentation thresholds. Now that the max high-value customer CLV is 5010, maybe they should lower the high-value bar from 4000 to 3500?

🙌 We should consider adjusting the segment thresholds. The high-value segment bar should be changed to 3500+ (instead of 4000+). This will allow us to maintain similar segment sizes..
This gives us, the data team, more insights to provide suggestions to the marketing team and helps us understand what matters most to them.
Wrapping it up: the Impact Radius advantage
In this example, we went from problem to solution using minutes of focused analysis instead of hours of random data diffing.
What we accomplished:
- ⚡ Root cause identified: A few clicks of metadata navigation with targeted queries
- 🎯 Impact assessed: All modified models and impact areas were fully covered
- 💪 Stakeholder prep: Quickly prepared relevant charts and explanations
- 🔄 PR review: Minutes to validate someone else's work instead of hours
By scoping what's impacted instead of checking every model, we saved time and ensured our validation covered all impacted and potentially impacted models and columns. Our stakeholders were properly educated and informed with ready-built charts. This gives us confidence we're ready to push our PR to production.
Ready to transform your workflow? Try Impact Radius for free today.
